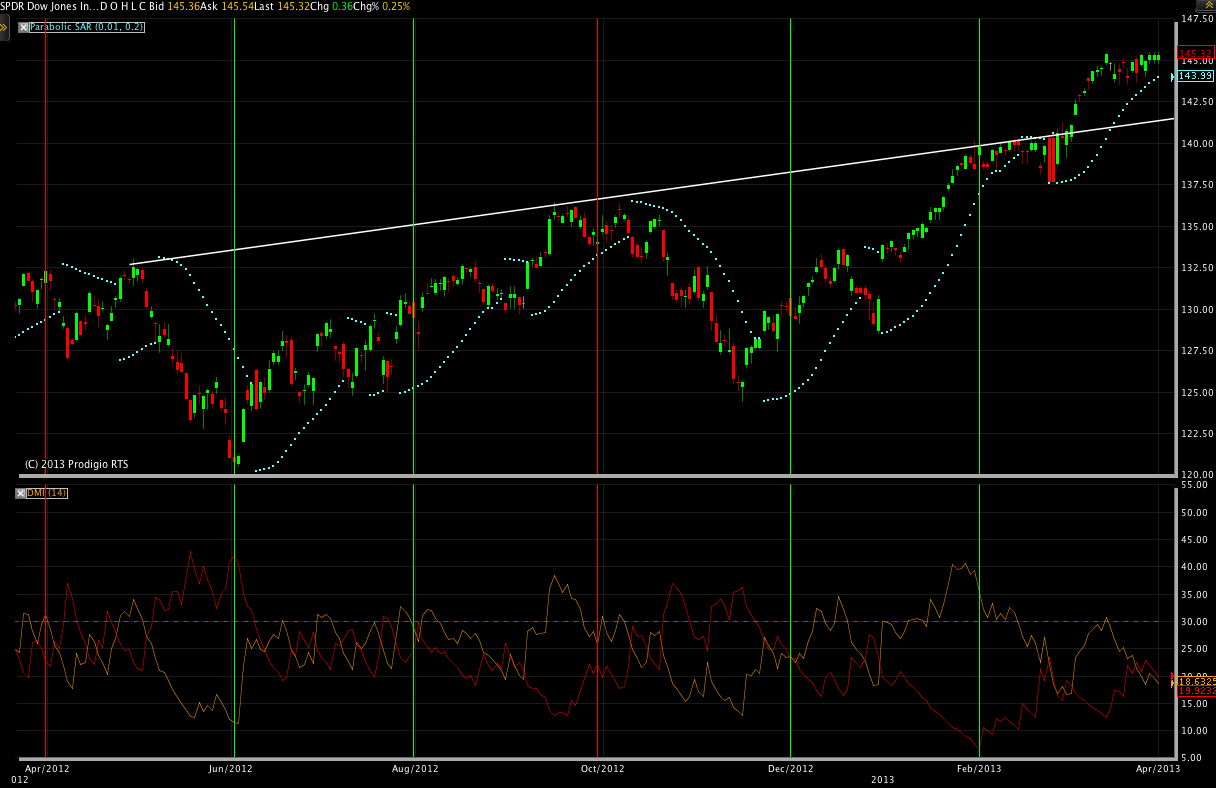
To effectively use the Parabolic SAR trading model you have
to be able to determine whether the price is trending; if not, this strategy
won’t be of much help. The basic idea behind the indicator is looking for a
downtrend being reversed to an uptrend and vice versa, by having the dots
crossover the price. I adjusted the settings of the Parabolic SAR. The maximum
acceleration factor is set to the predefined value 0.2 and the acceleration
factor I changed it to 0.01. Is very common to see traders using 0.01, and
currency traders using 0.02, however, I would recommend playing around and
choosing a setting that better fits the trend and especially your trading
style. This first quarter of 2013, the Dow Jones ETF $DIA has incremented more than 11%, making investors a bit leery about the near
term of the DJIA; all due to strong speculation – “either a signal that our
economy has zoomed past the lingering aftereffects of the Great Recession, or
evidence of a bubble about to pop, as CNBC wondered a little while ago.” I will
pay close attention to its performance in the following weeks, and use the
Parabolic SAR as a method to determine whether the trend is persisting or not.
Alexander Schachter
0 comments: